Every posted round is measured across 340+ performance metrics, producing 600+ performance data points. This tour follows one demo account through the platform: capture, the seven views of a round, tournament events, your history and trends, practice priorities, and ShotIQ.
EvoGolf is rolling out through golf associations. Leave your details and you’re first in line when yours joins.
A scorecard and a pencil. Your phone stays in the bag.
What you do here: record your shots on the EvoGolf scorecard during the round, then photograph the card and post it when you are done. Prefer digital? Enter the round in the app or on the web instead.
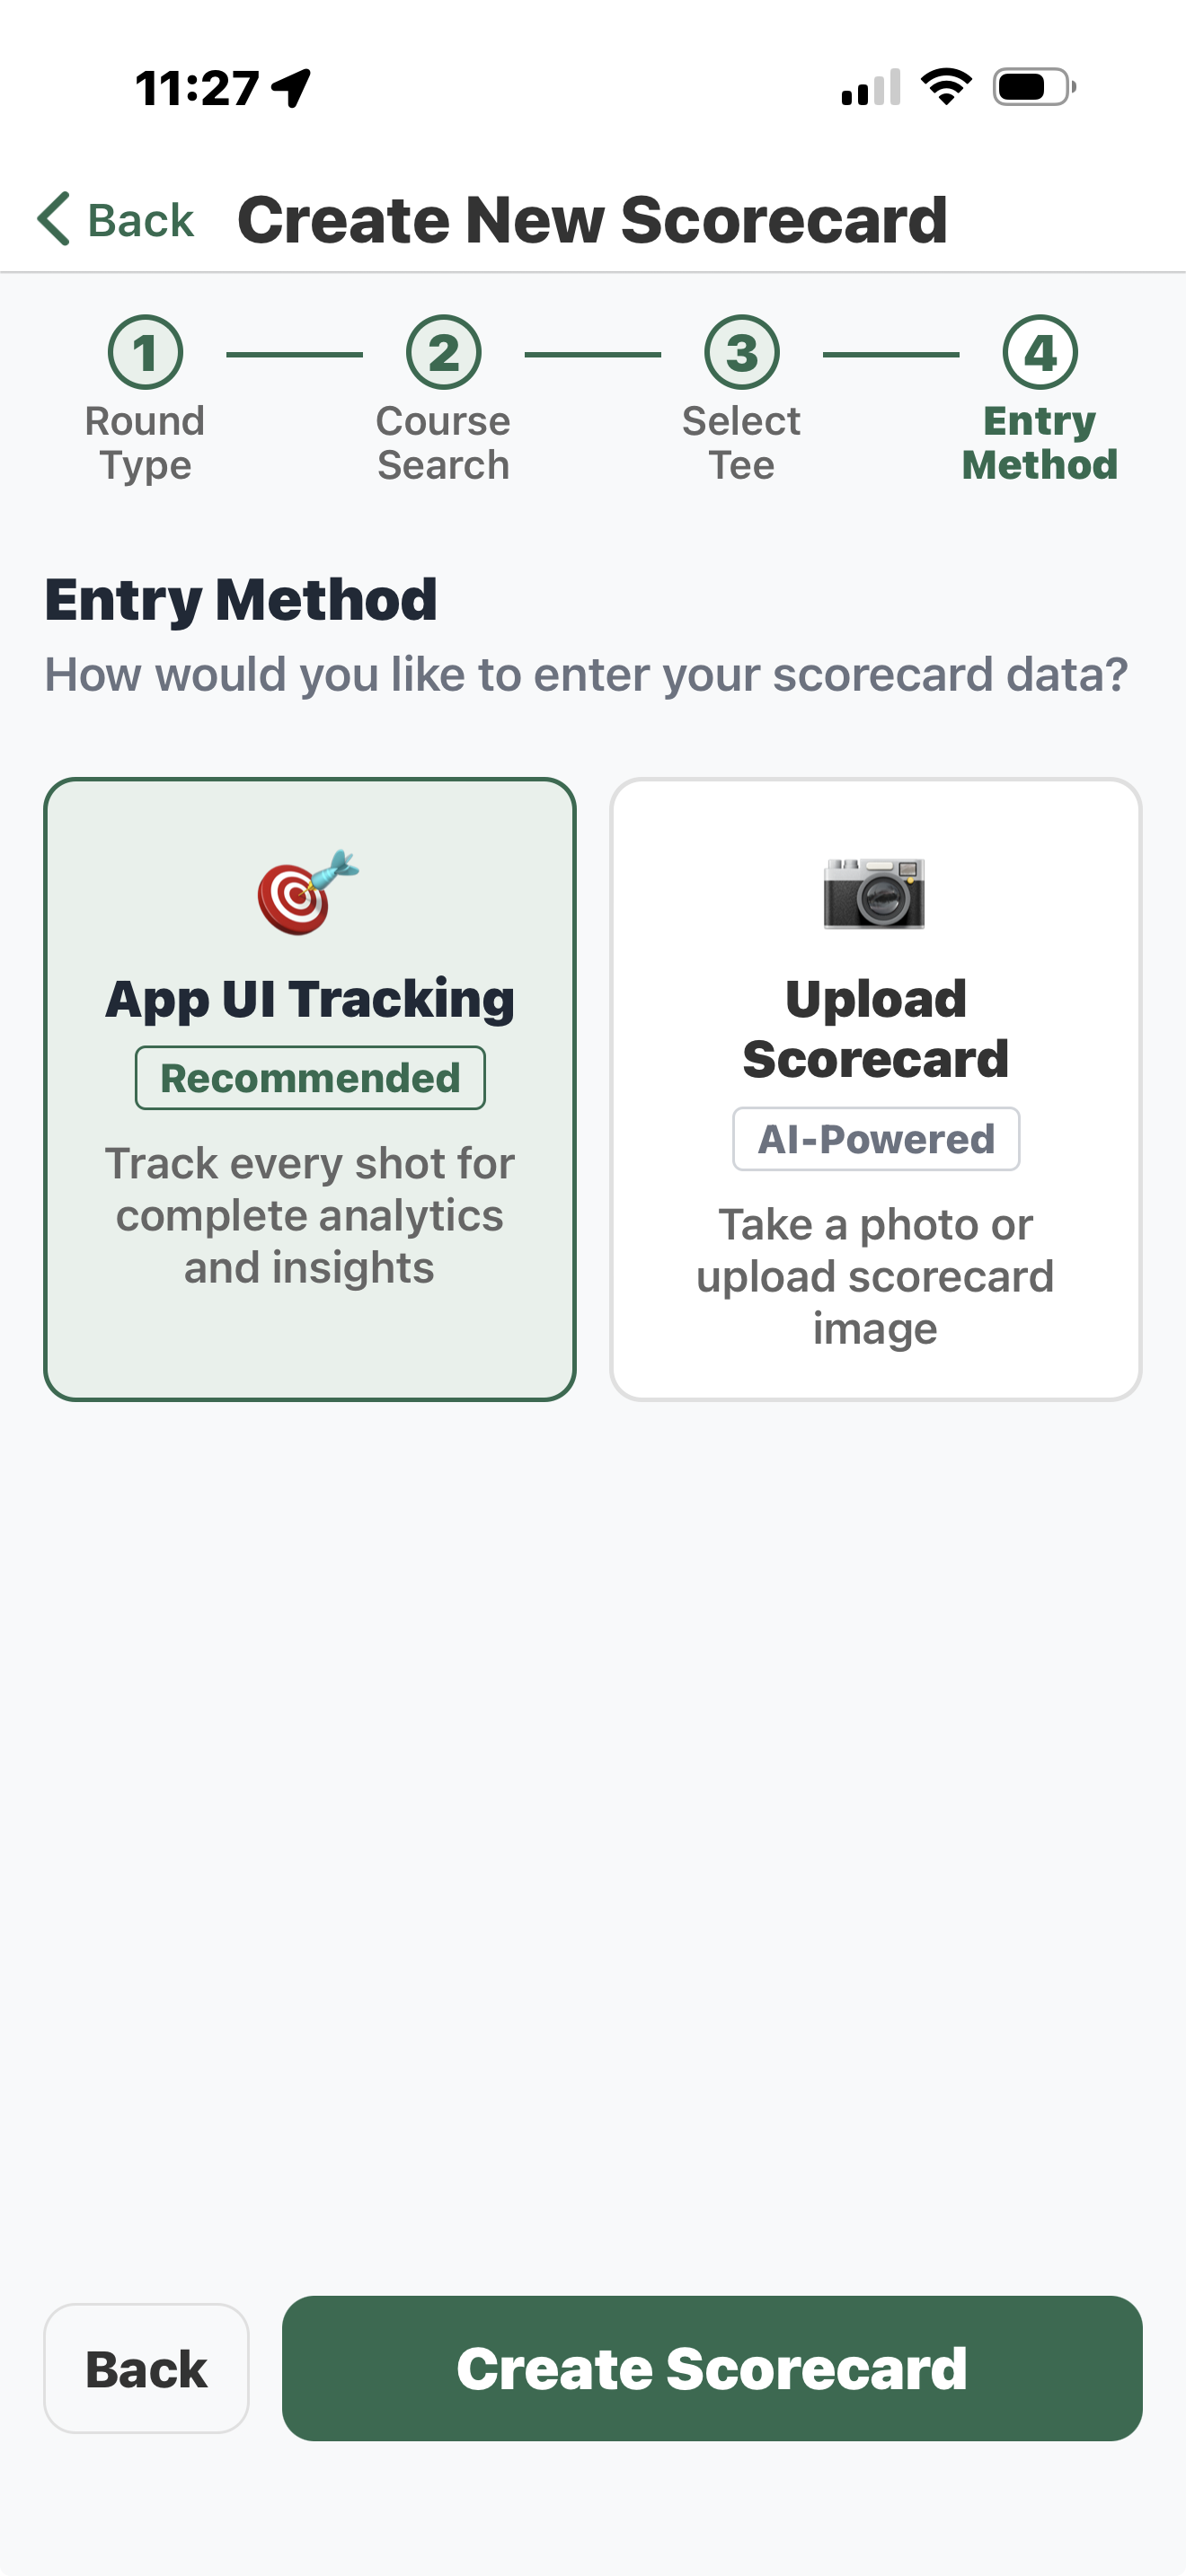
The EvoGolf scorecard captures hole scoring data without breaking the flow of your round.Posting a card in the app. Demo account screen
01
Keep your attention in the round.
Record your shots on the EvoGolf scorecard without opening an app between shots.
02
Finish the round. Then post.
Photograph your card, review the details, and post when you’re done. Give the analysis its own time.
03
Build your development record.
Every posted round adds evidence. Revisit recurring patterns, work on the specific gaps, and track what changes.
02 / UNDERSTAND THE ROUND · PLAYER
Seven views of one round.
What you learn here: where the round won and lost strokes, by category, by hole and by shot. Every posted round produces all seven views. Pick a view, then open its notes for what it measures and what it tells you.
The 30-second read of your round: where strokes were won, where they were lost, and what to take into your next practice session.
Demo account screen
Overview
What it measures
Key stats — fairways, GIR, putts, scoring average
Strokes Gained per category — Tee, Approach, Short Game, Putting
Performance by par — par 3, par 4, par 5 separated
Whether you carry momentum hole-to-hole, or each hole is independent
The mental pattern that follows your bad holes
Where in the round you tend to lose focus
Whether you’re converting your scoring opportunities or leaving them behind
The single most fixable mental pattern in your round
03 / COMPARE TOURNAMENT ROUNDS · PRO
Diagnose the tournament, not just each round in it.
What you learn here: two rounds, three rounds, a four-day event: each becomes one diagnostic, analyzed at the same depth as a single round, so you see where the event was won or lost.
Instead of two scorecards, you see the tournament as one performance: 46.4% fairways, 59.3% greens, −6.9 strokes gained per round.
Demo account screen
04 / YOUR HISTORY · PRO
See whether you’re actually getting better.
What you learn here: the same seven-category engine applied to every round you have posted, surfacing what recurs, what drifts, and the game underneath your scores. In the demo account, nine rounds averaging 75.9.
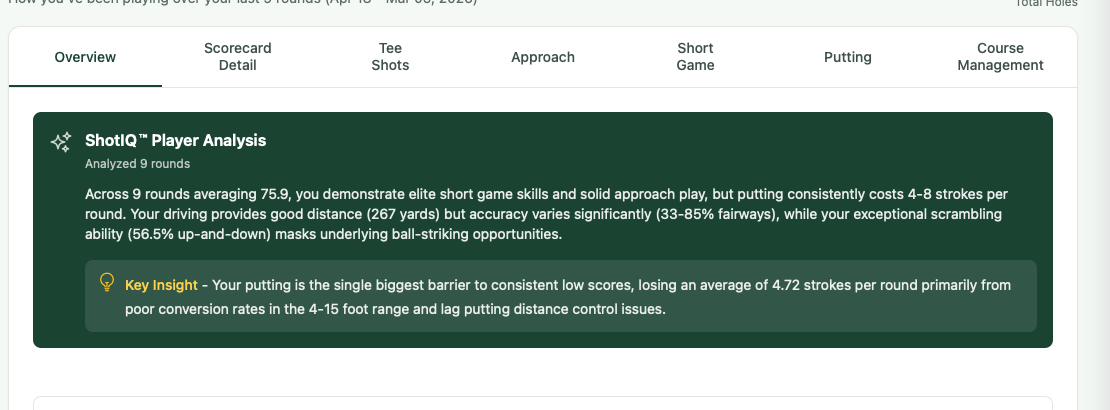
Every multi-round dashboard opens with ShotIQ’s summary: “Across 9 rounds averaging 75.9 … putting consistently costs 4–8 strokes per round”, with the key insight that putting loses 4.72 strokes a round from the 4–15 foot range.
Demo account screen
05 / TRENDS · PRO AI
See the trends your scores hide.
What you learn here: direction and magnitude per category, and the crossover patterns that decide where your scores are headed next, even when the scorecard looks flat. ShotIQ writes the trend story before the trend chart.
“Your recent trajectory shows dramatic improvement in driving (jumped from −1.80 to +0.20 SG) … putting has dropped alarmingly from −0.71 to −2.67 SG.” The kind of paragraph no chart can write.
Demo account screen
Driving recovered from −1.80 to +0.20. Putting dropped from −0.71 to −2.67. One category’s gain, another’s decline, in the same stretch of rounds. The four-card verdict per category sits in the history gallery above.The crossover one round can’t show you
06 / PRACTICE PRIORITIES · PRO AI
Don’t guess what to practice.
What you do here: read a ranked list of practice priorities, each paired with the statistic that flagged it, the root cause, and the drills to work on it. ShotIQ does the prioritization. You do the practice.
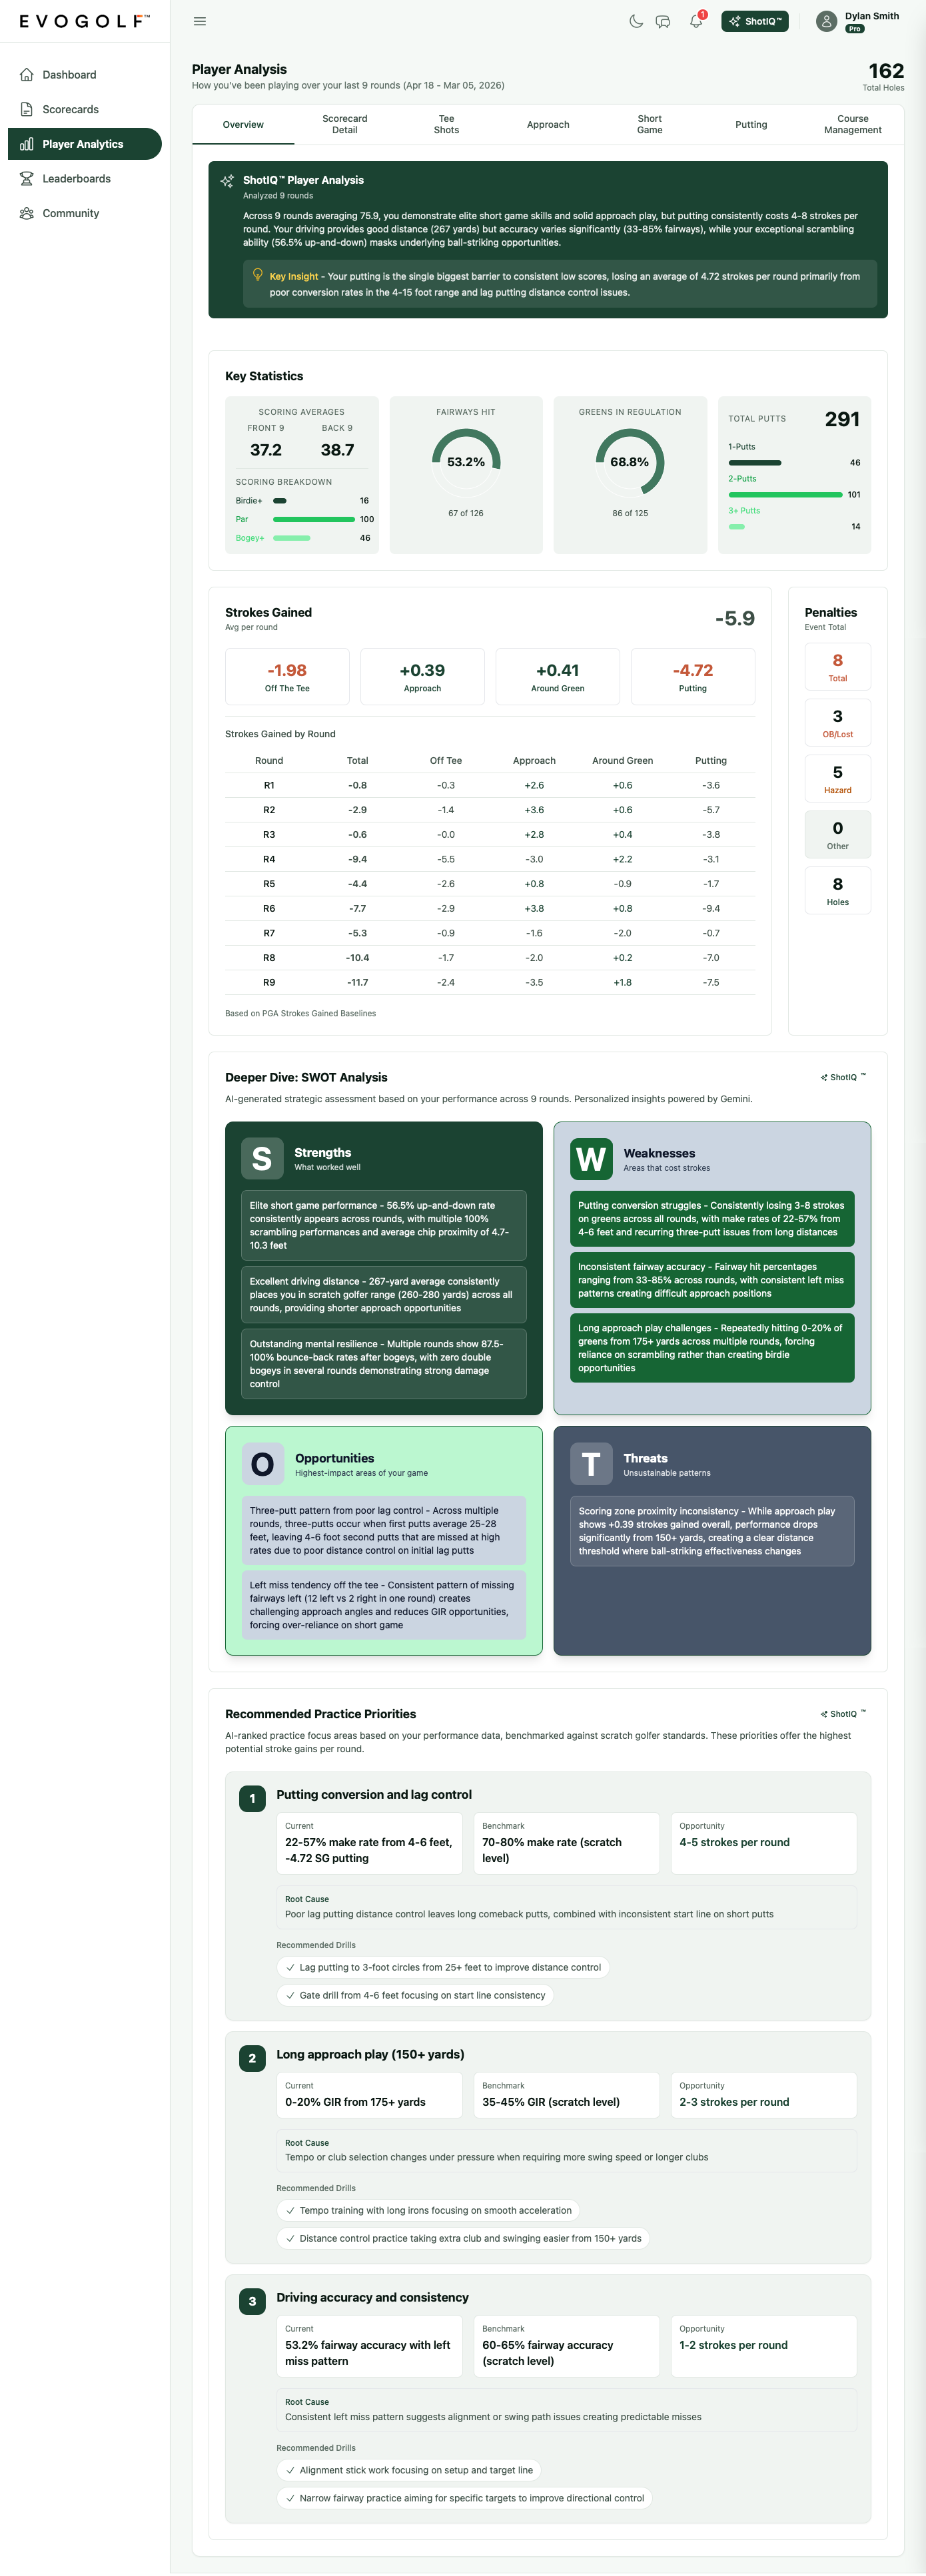
The full player analysis, ending in three ranked priorities. Scroll the frame or open it full screen.
Demo account screen
1 · Putting conversion and lag control
Flagged by: 22–57% make rate from 4–6 feet; −4.72 strokes gained putting per round.
Root cause: lag distance control leaves long comeback putts; inconsistent start line on short putts.
Lag putting to 3-foot circles from 25+ feet
Gate drill from 4–6 feet for start line
2 · Long approach play (150+ yards)
Flagged by: 0–20% greens hit from 175+ yards.
Root cause: tempo or club selection changes under pressure with longer clubs.
Tempo training with long irons
Distance control taking extra club from 150+ yards
3 · Driving accuracy and consistency
Flagged by: 53.2% fairway accuracy with a left miss pattern.
Root cause: a consistent left miss suggests alignment or swing path.
Alignment stick work on setup and target line
Narrow fairway practice aiming for specific targets
Priorities exist for your round, your event and your full history, and update as your data changes. The figures above are the demo account’s; they are not a promise of strokes recovered.
07 / ASK SHOTIQ · EVERY EDITION
Ask anything about your game.
What you do here: ask a question in plain language. ShotIQ uses your scorecards, performance metrics and prior analysis to explain what the numbers mean and help you decide what to work on next.
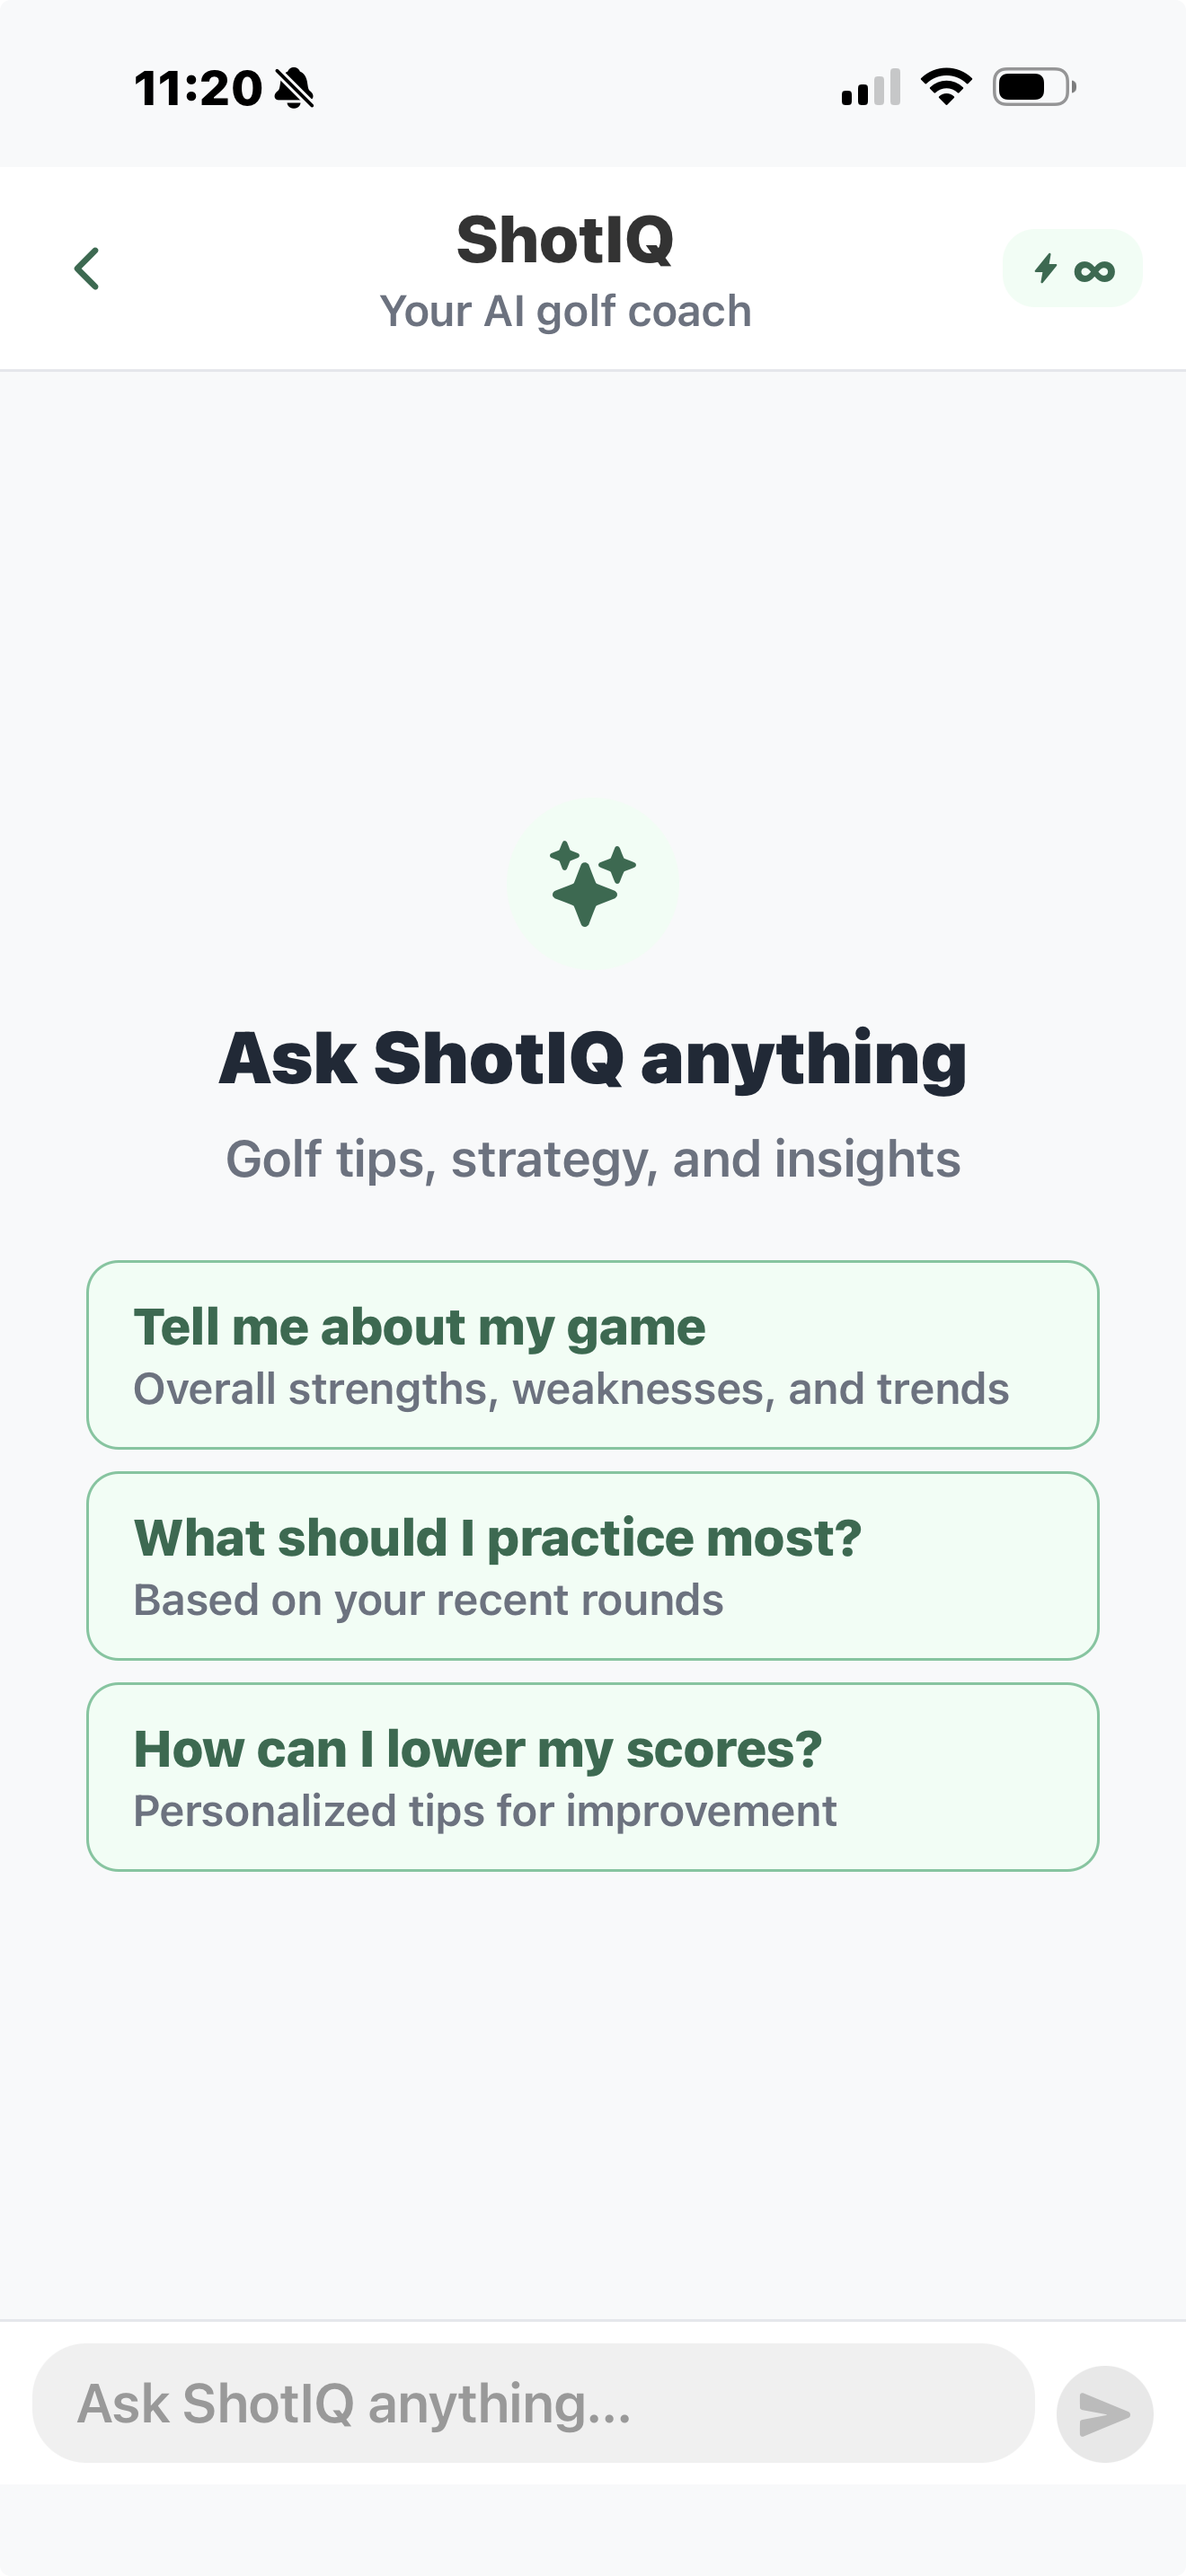
ShotIQ in the app: one tap from every view.
Demo account screen
AN EXAMPLE CONVERSATION
YOU
What’s going on with my approach shots from 75–125 yards?
SHOTIQ
From 75–125 yards you have lost 20.8 strokes over 10 rounds, −0.42 a shot — more per shot than any other distance. It is worse from the rough (−0.51) than the fairway (−0.37).
Practice distance control in that band: three clubs, three targets, from fairway and rough, recording where each shot finishes. Then revisit the band as you post more rounds.
Example response built from one player’s posted rounds. Full round-history context is included with Pro and Pro AI.
How it works
ShotIQ considers your scorecard, performance metrics and any prior analysis, then cites the numbers in the answer when they matter. Your real game, not generic golf advice.
Specific, not generic
“Practice putting more” becomes a prescription: your stats, your patterns, your distance-band breakdown.
One tap from every view
Home screen, any round, any trend chart, your practice plan. The question never has to leave the context where it came up.
ShotIQ is included on every edition. Player: 5 credits a month · Pro: 15 credits a month with full round-history context · Pro AI: 30 credits a month with full round-history context.
Ready to find your pattern?
EvoGolf is rolling out through golf associations. Leave your details and you’re first in line when yours joins.
 Get EvoGolf